
Hacettepe University’s academic performance results for 2025 are now available to academic staff through the H-VERA Academic Performance Module. In addition to individual performance results, the module provides analyses at department, academic unit and university levels.
Developed as part of Hacettepe University’s Data Integration, Reporting and Analysis System (H-VERA), the module was launched on 26 October 2026. The first assessment covers activities undertaken between 1 January and 31 December 2025. The activity records used in the assessment were made available to academic staff for verification in June 2026. These records were reviewed in light of the feedback received before the scores were calculated.
Assessing academic contributions
The assessment places research and teaching at its centre while also incorporating administrative and societal contributions. The General Performance Score (GPP) is the weighted sum of scores in these four areas. An optimisation-based method automatically determines the weights in line with the University’s priorities, taking each academic’s strengths into account. Contribution percentages show how much each area contributes to the total score after weighting.
Four access levels from the university to the individual
Access permissions within the module follow the University’s administrative hierarchy. At each level, access to detailed results is restricted to the user’s area of responsibility.
Level 1 · Rectorate: The Rector and authorised administrators can review results for the university as a whole, all academic units, their departments and academic divisions, and academic staff.
Level 2 · Academic unit: Deans and directors can access indicators for their own academic unit, its departments or academic divisions, and the results of staff within the unit.
Level 3 · Department: Department heads can review indicators for their own department and the results of academic staff working within it.
Level 4 · Individual: Academic staff can view their activity records in the performance report and their own scores, contribution profiles and positions within comparison groups on the personal analysis page.
In the University Pool, scores are calculated using a common pool comprising all academic staff. In the Unit Pool (labelled Faculty Pool on the individual, department and faculty pages), calculations use only the staff of the relevant academic unit. The selected staff group determines whose results are displayed without changing the calculation pool.
The module aims to make academic contributions visible and support institutional planning. Its first year of implementation is regarded as a pilot period. Academic staff can access their performance reports, personal analyses and user guides by logging in with their institutional accounts at hvera.hacettepe.edu.tr.
Note on the figures: The screenshots have been prepared for demonstration purposes. The illustrative scores, rankings, percentages and staff counts are arbitrary and do not reflect actual performance results. The figures should not be interpreted together to draw conclusions about any actual individual or unit.
Overview screens for the access levels:
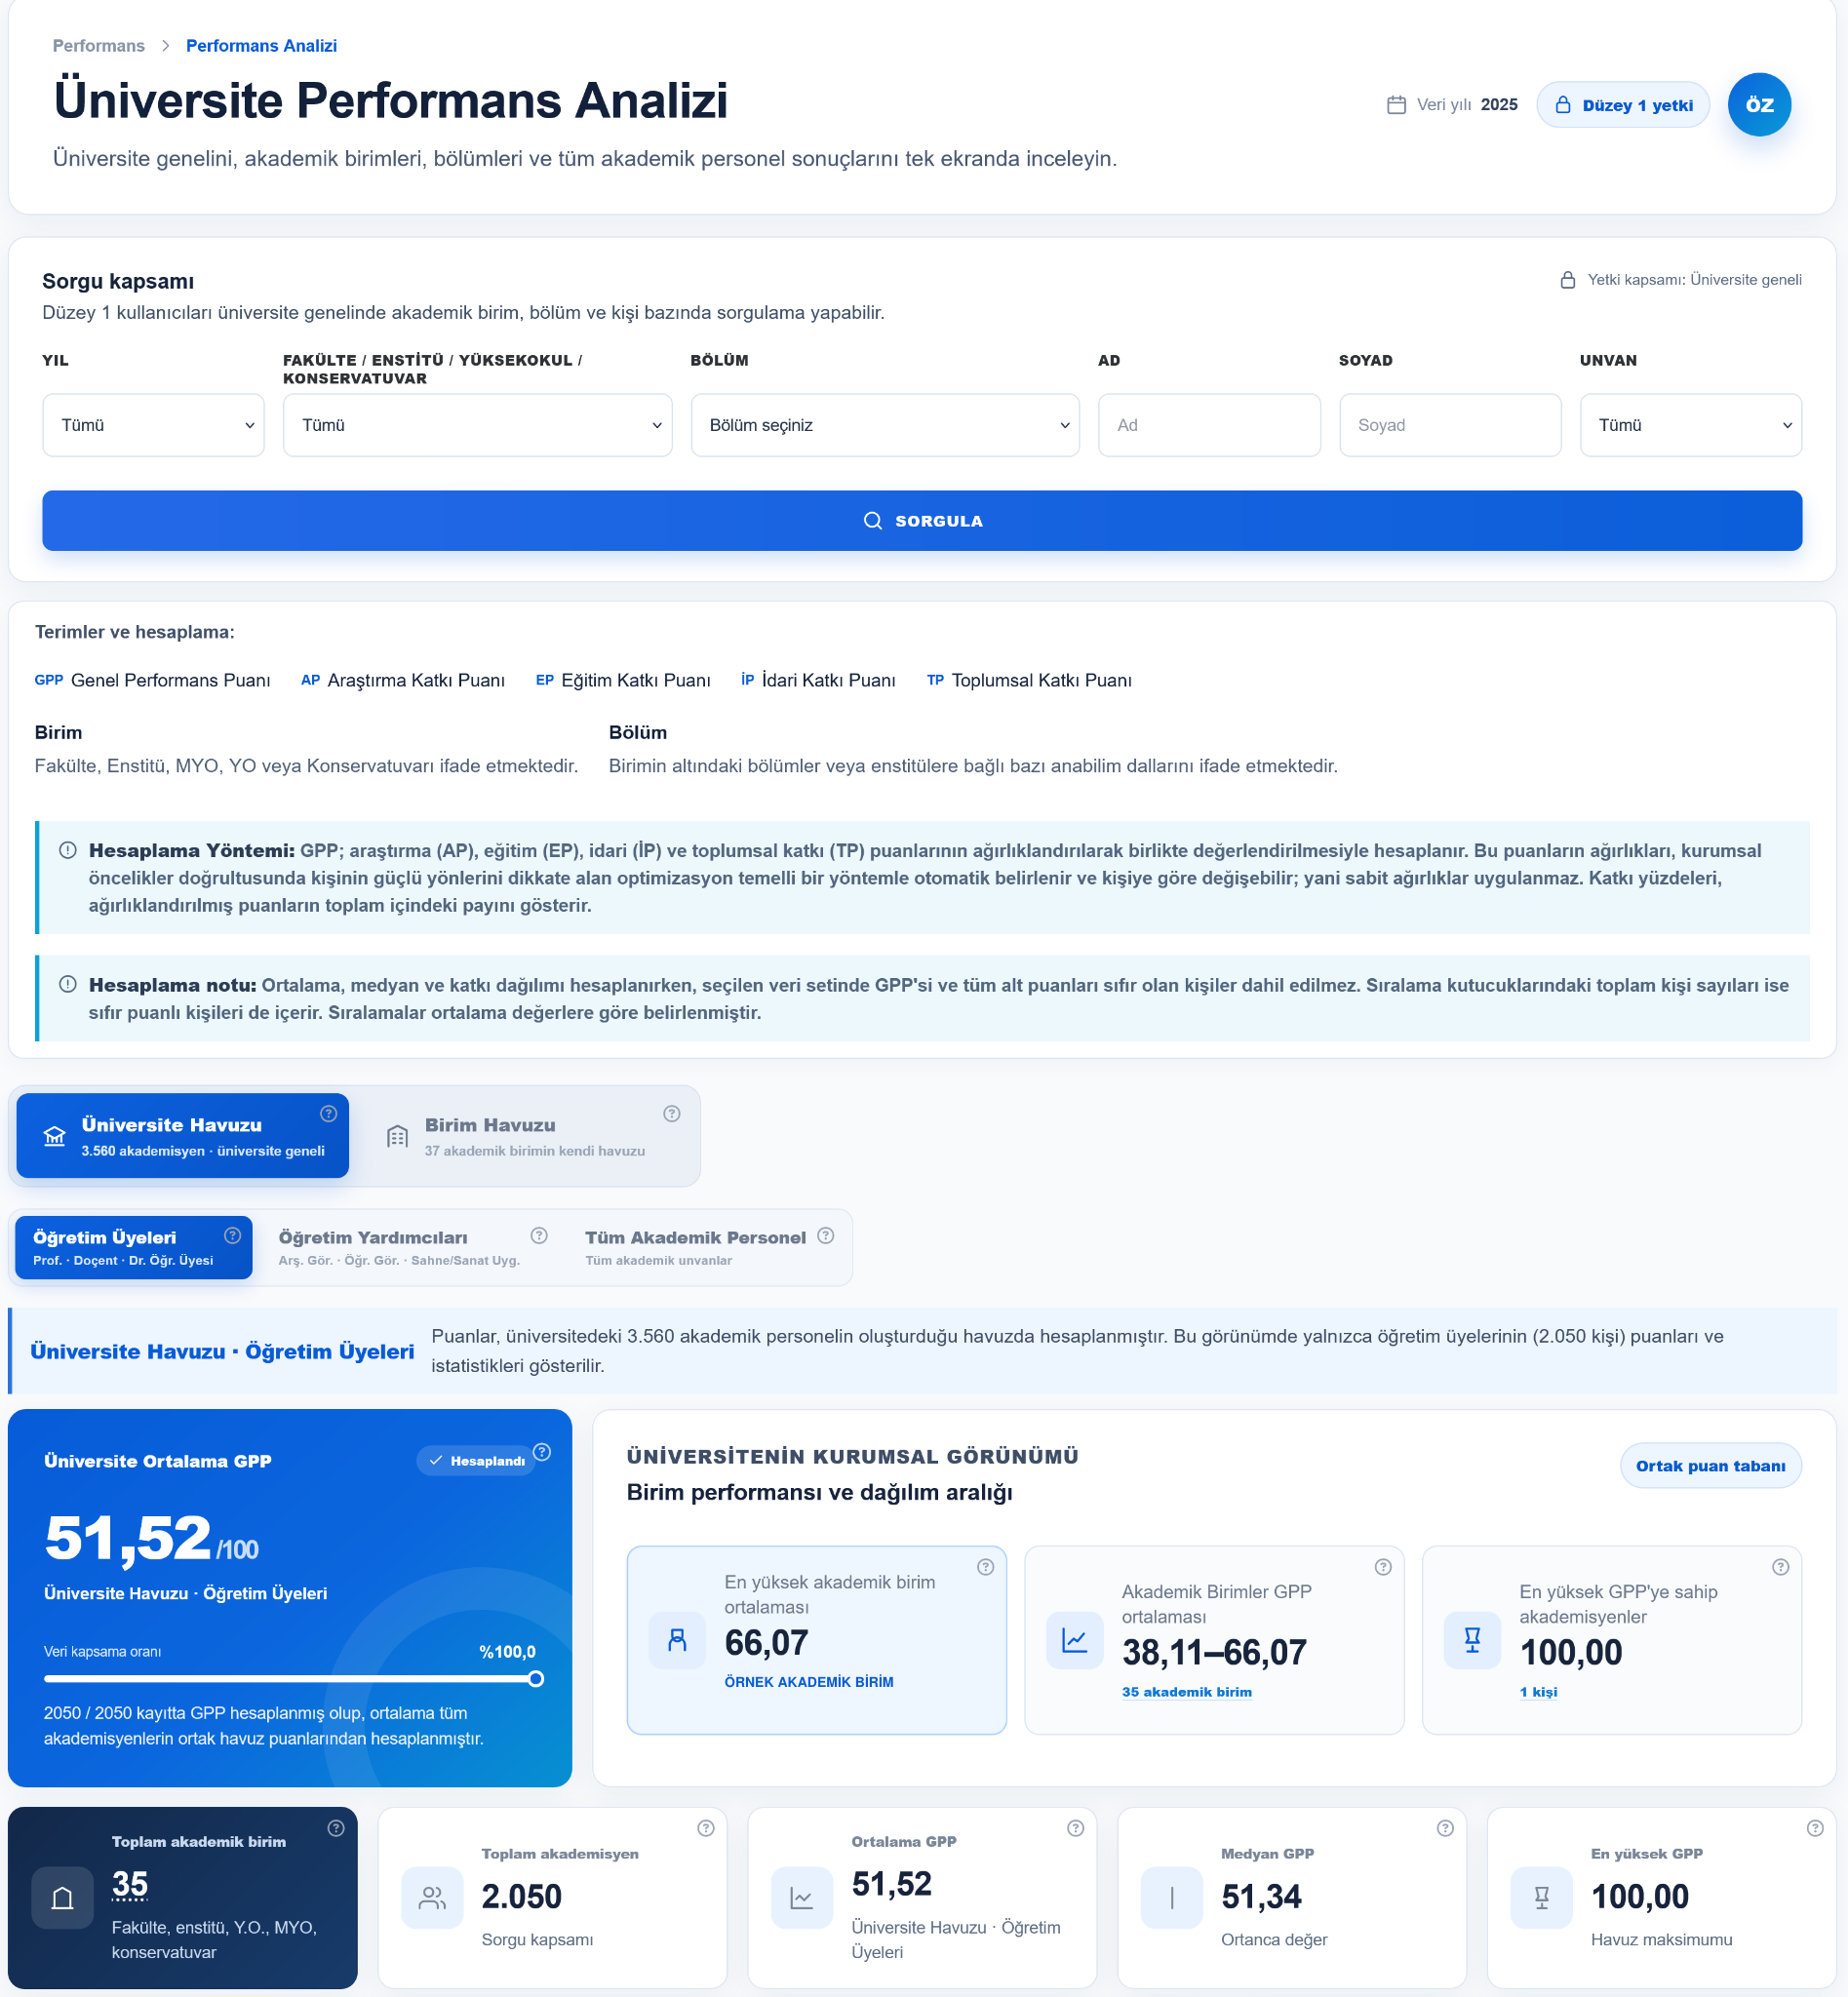
Figure 1: University performance analysis. University-wide indicators and the search panel for filtering by year, academic unit, department, first name, surname and academic title.
Level 2: Academic unit
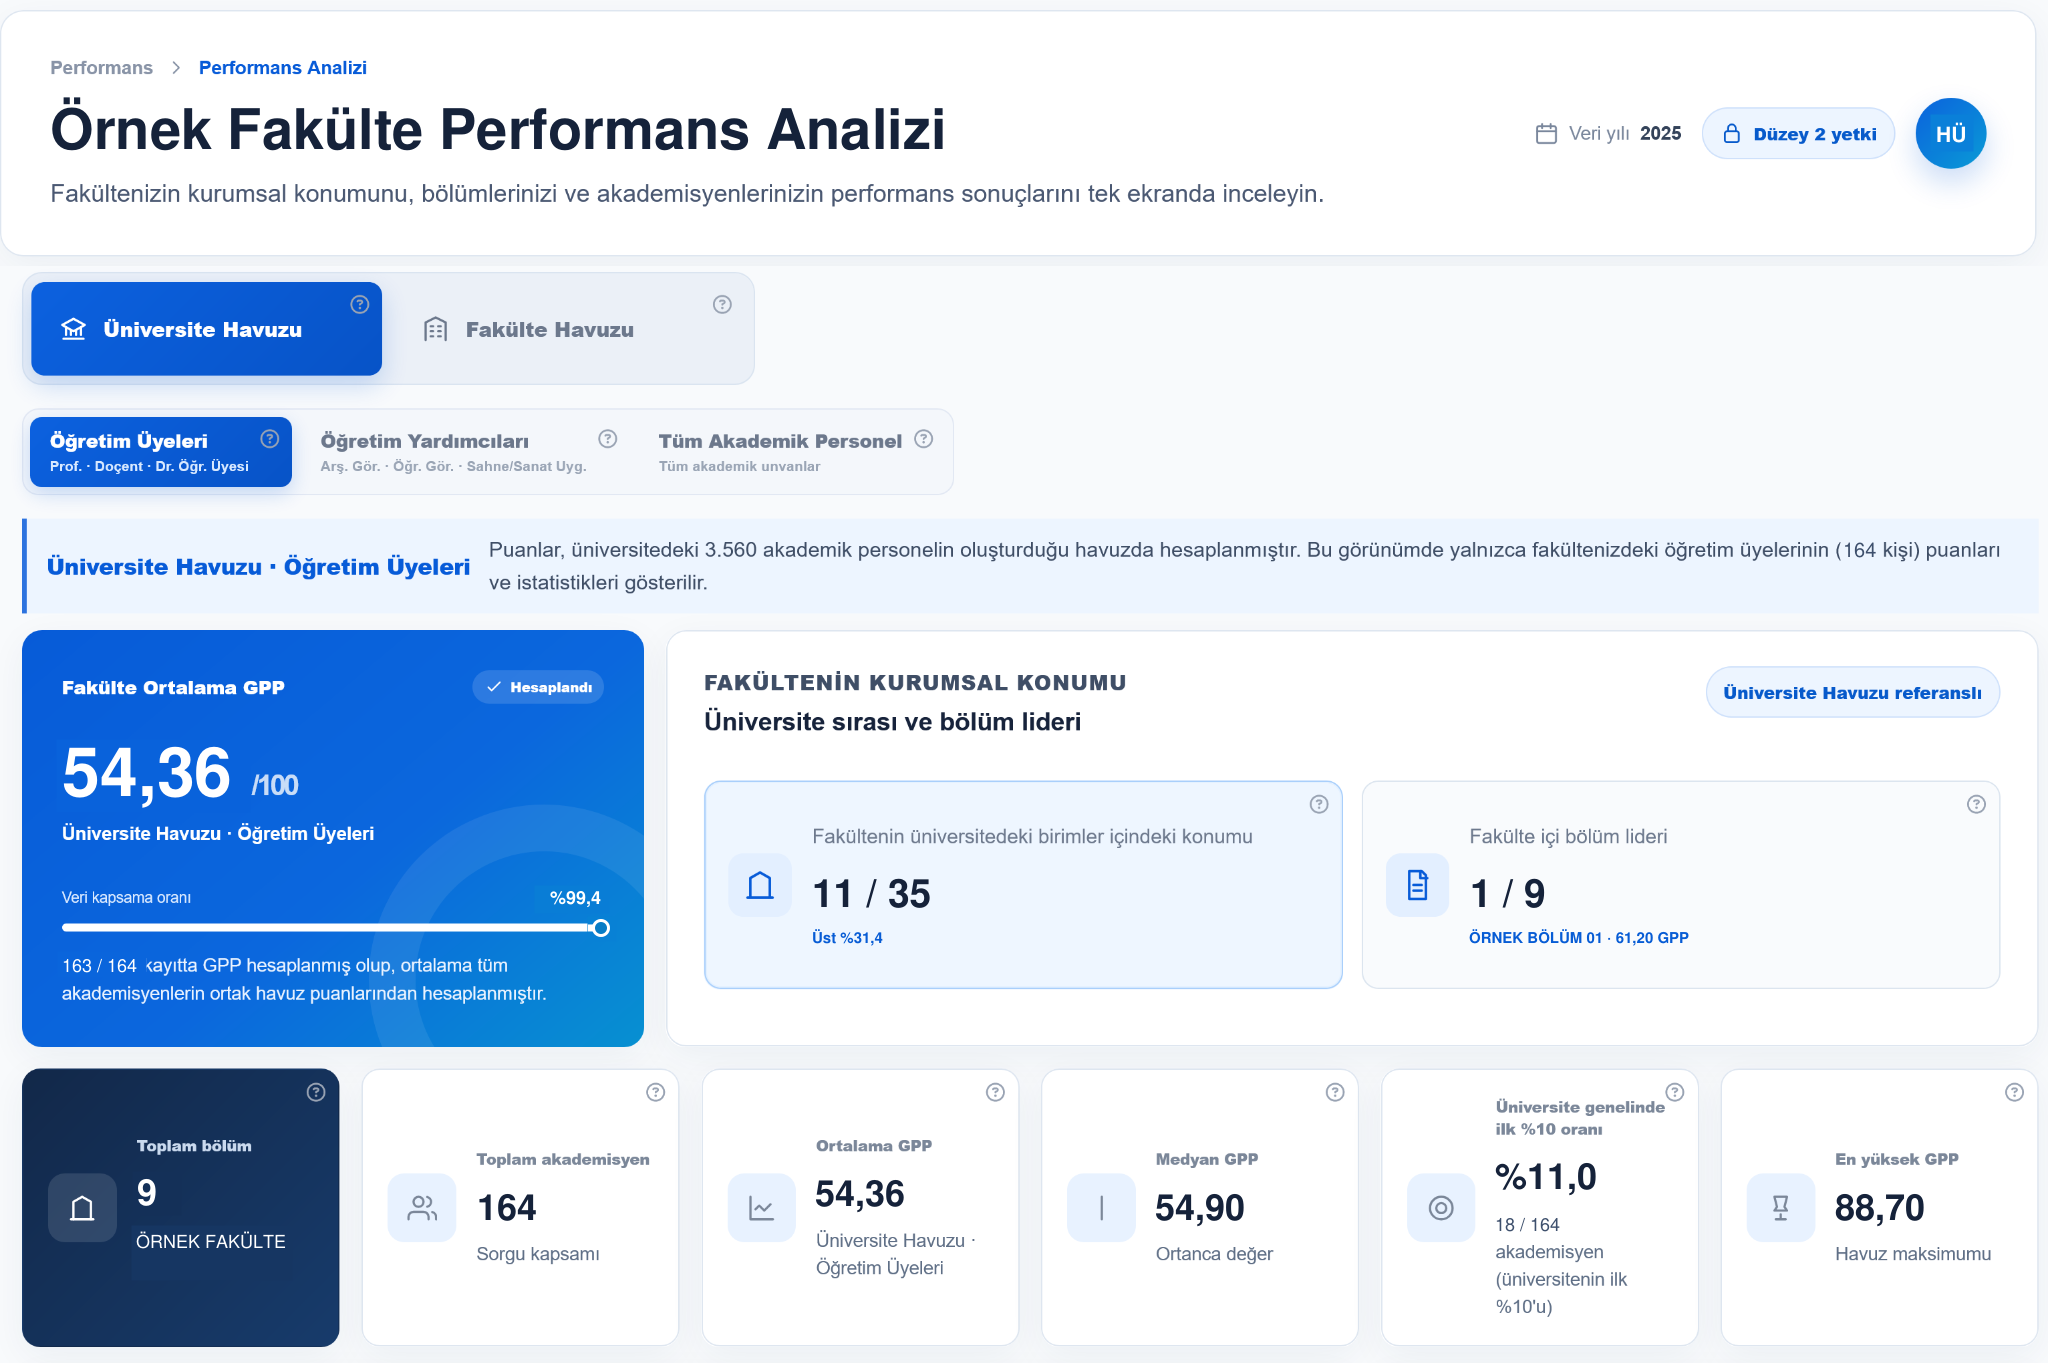
Figure 2: Academic unit performance analysis. The sample faculty’s average score, its position within the university and summary indicators at department level.
Level 3: Department
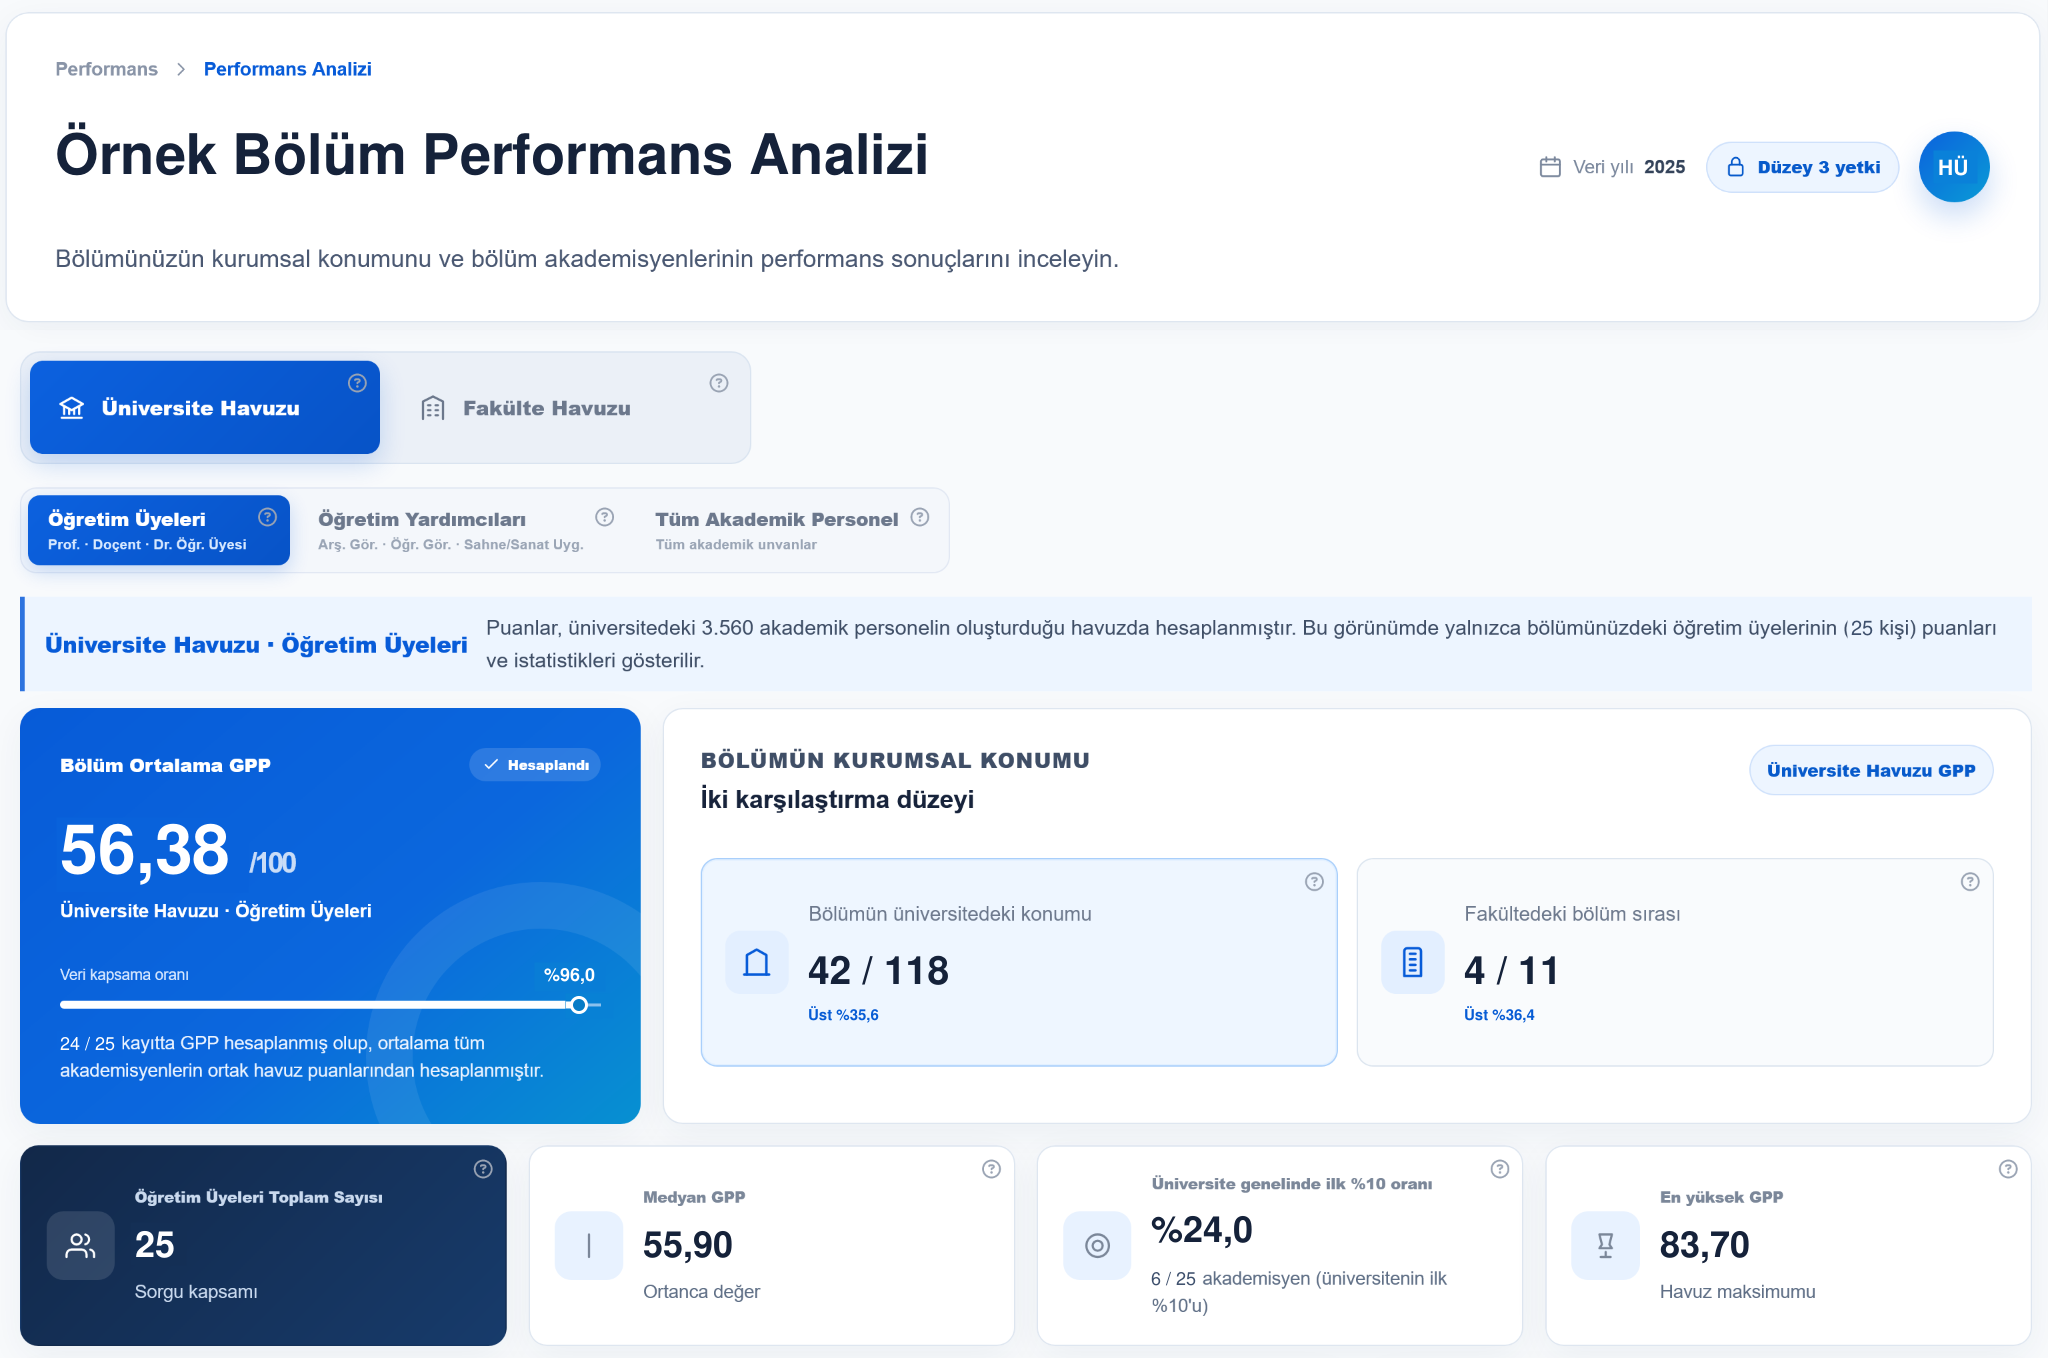
Figure 3: Department performance analysis. The sample department’s average score and its position within the university and faculty.
Level 4: Individual
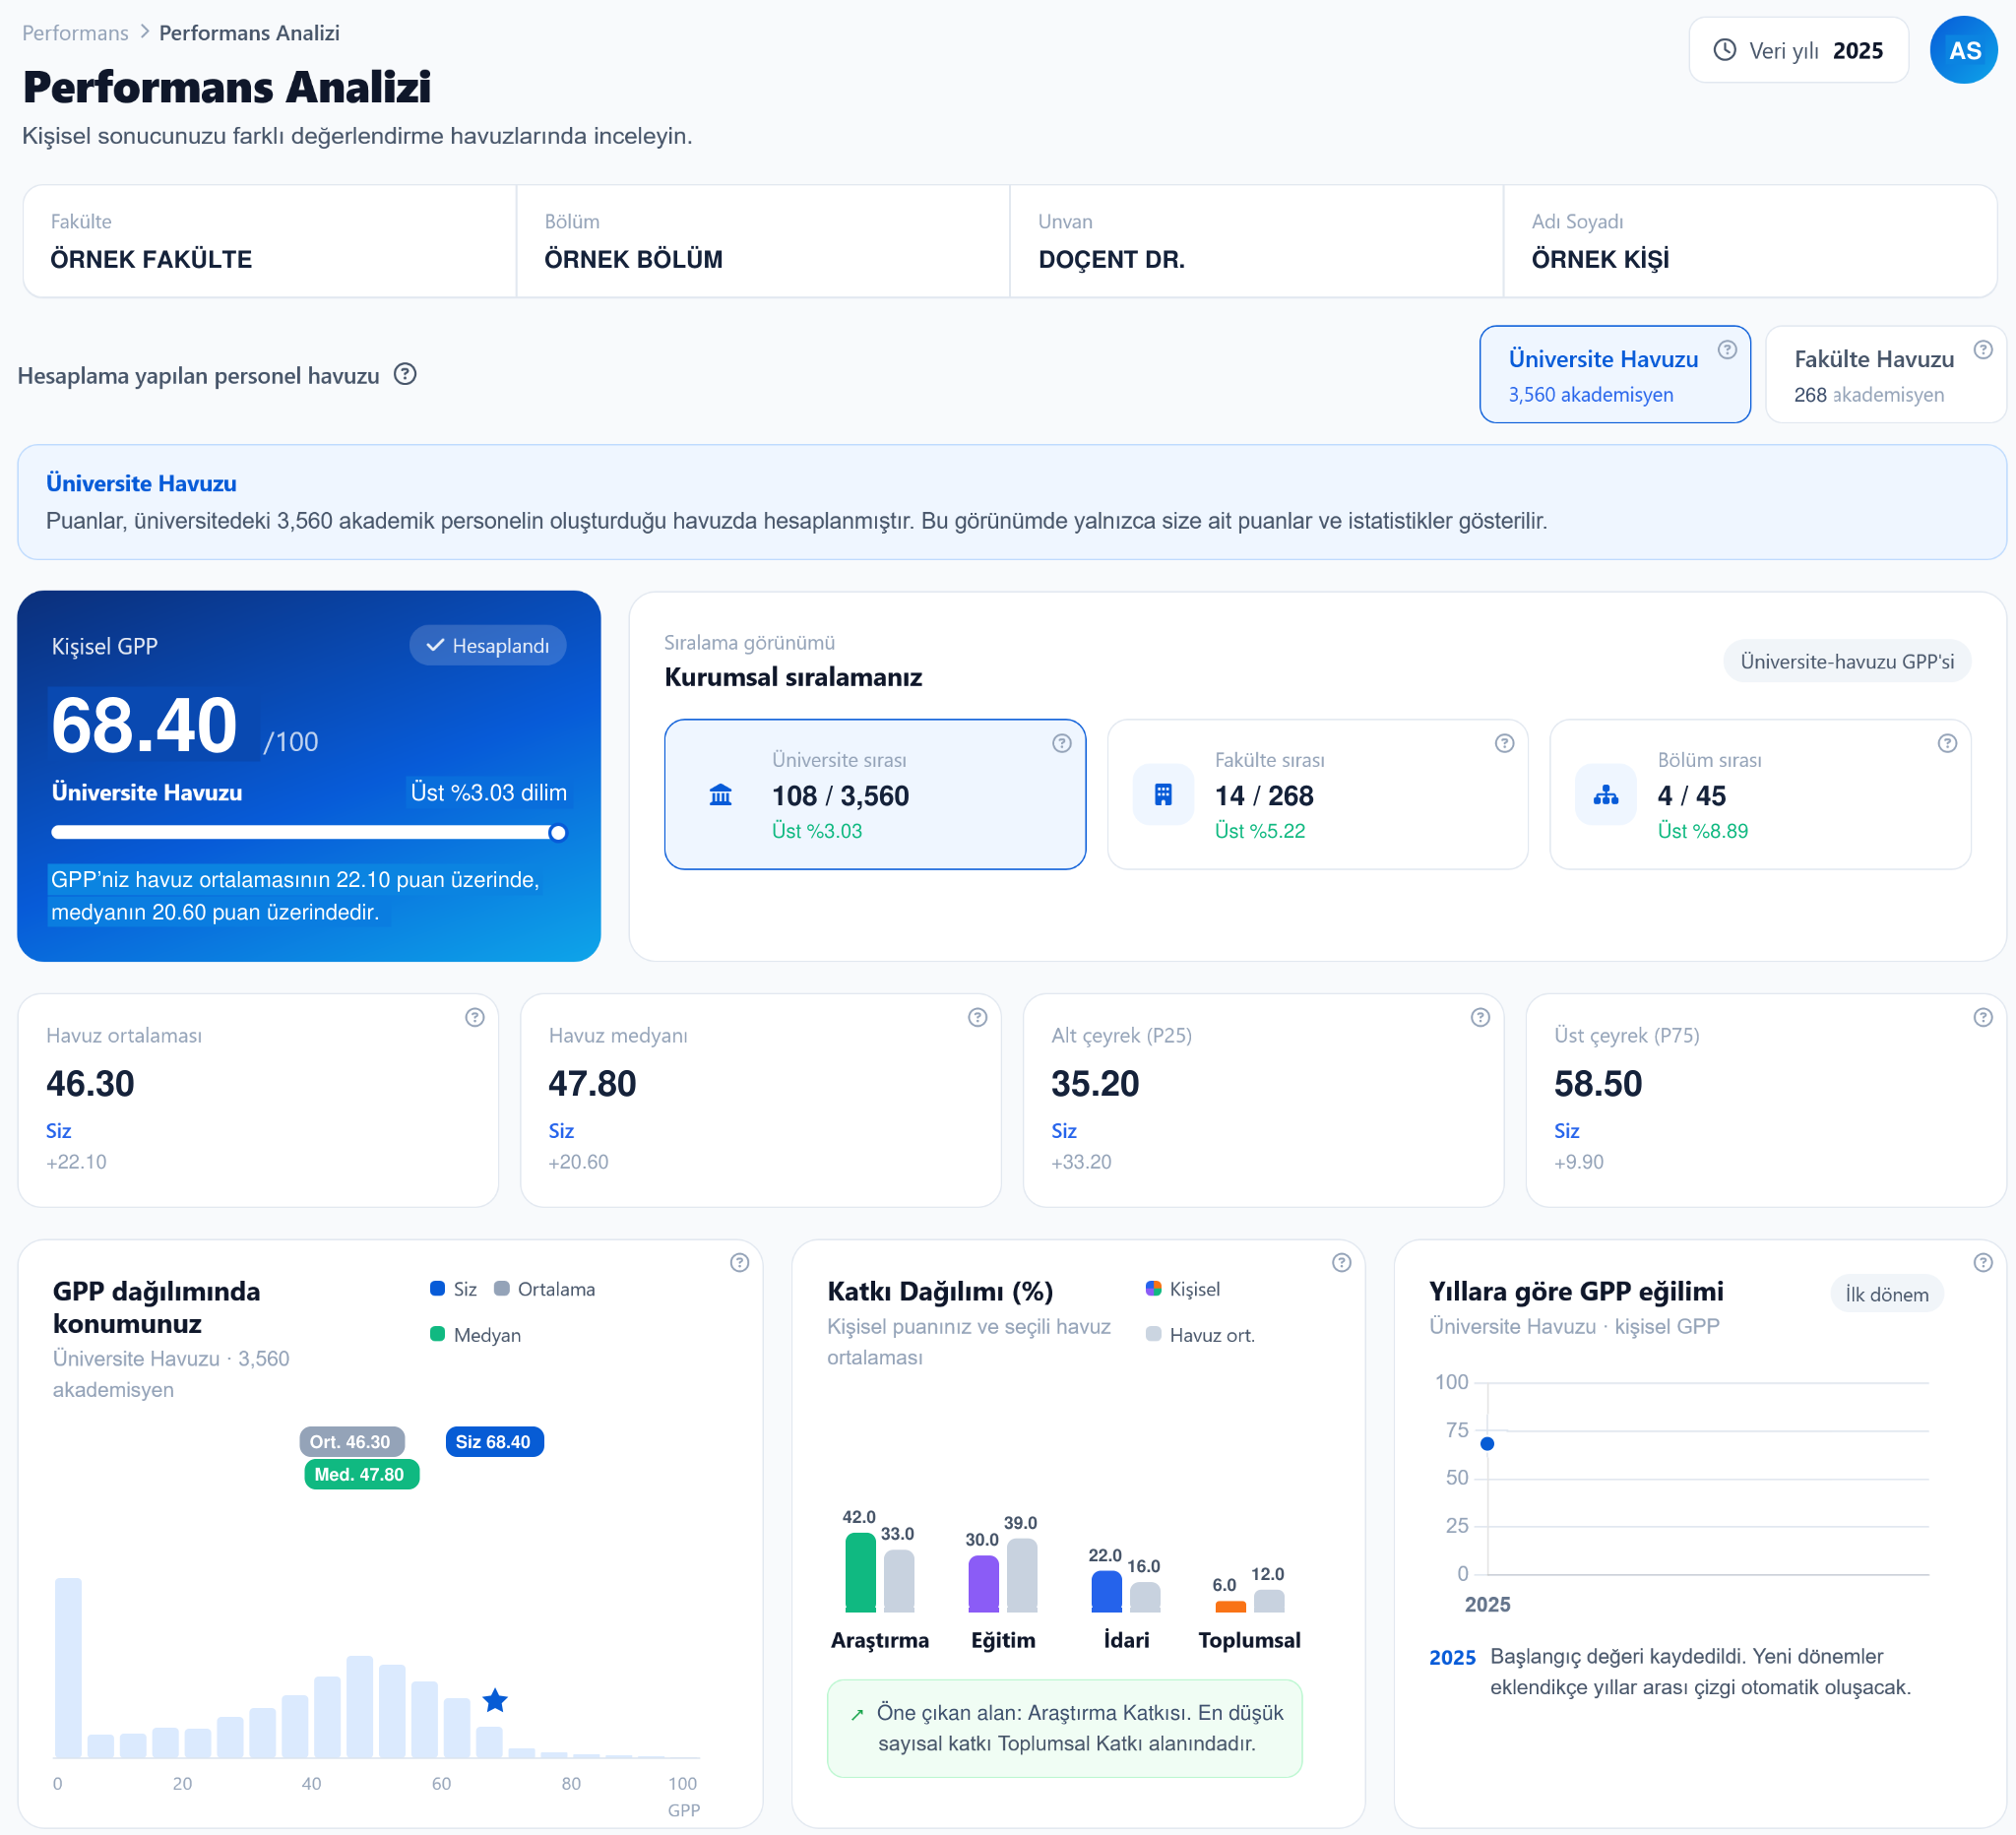
Figure 4: Personal performance analysis. A sample academic’s score, rankings, position within the score distribution and contribution profile.
Examples of analyses
Distribution charts show the score ranges in which results are concentrated, while contribution charts show how the total score is composed across activity areas. Comparison tables provide detailed results for academic units, departments and individuals within the user’s authorised scope.
The sample scores, rankings and contribution percentages below do not represent actual performance results.
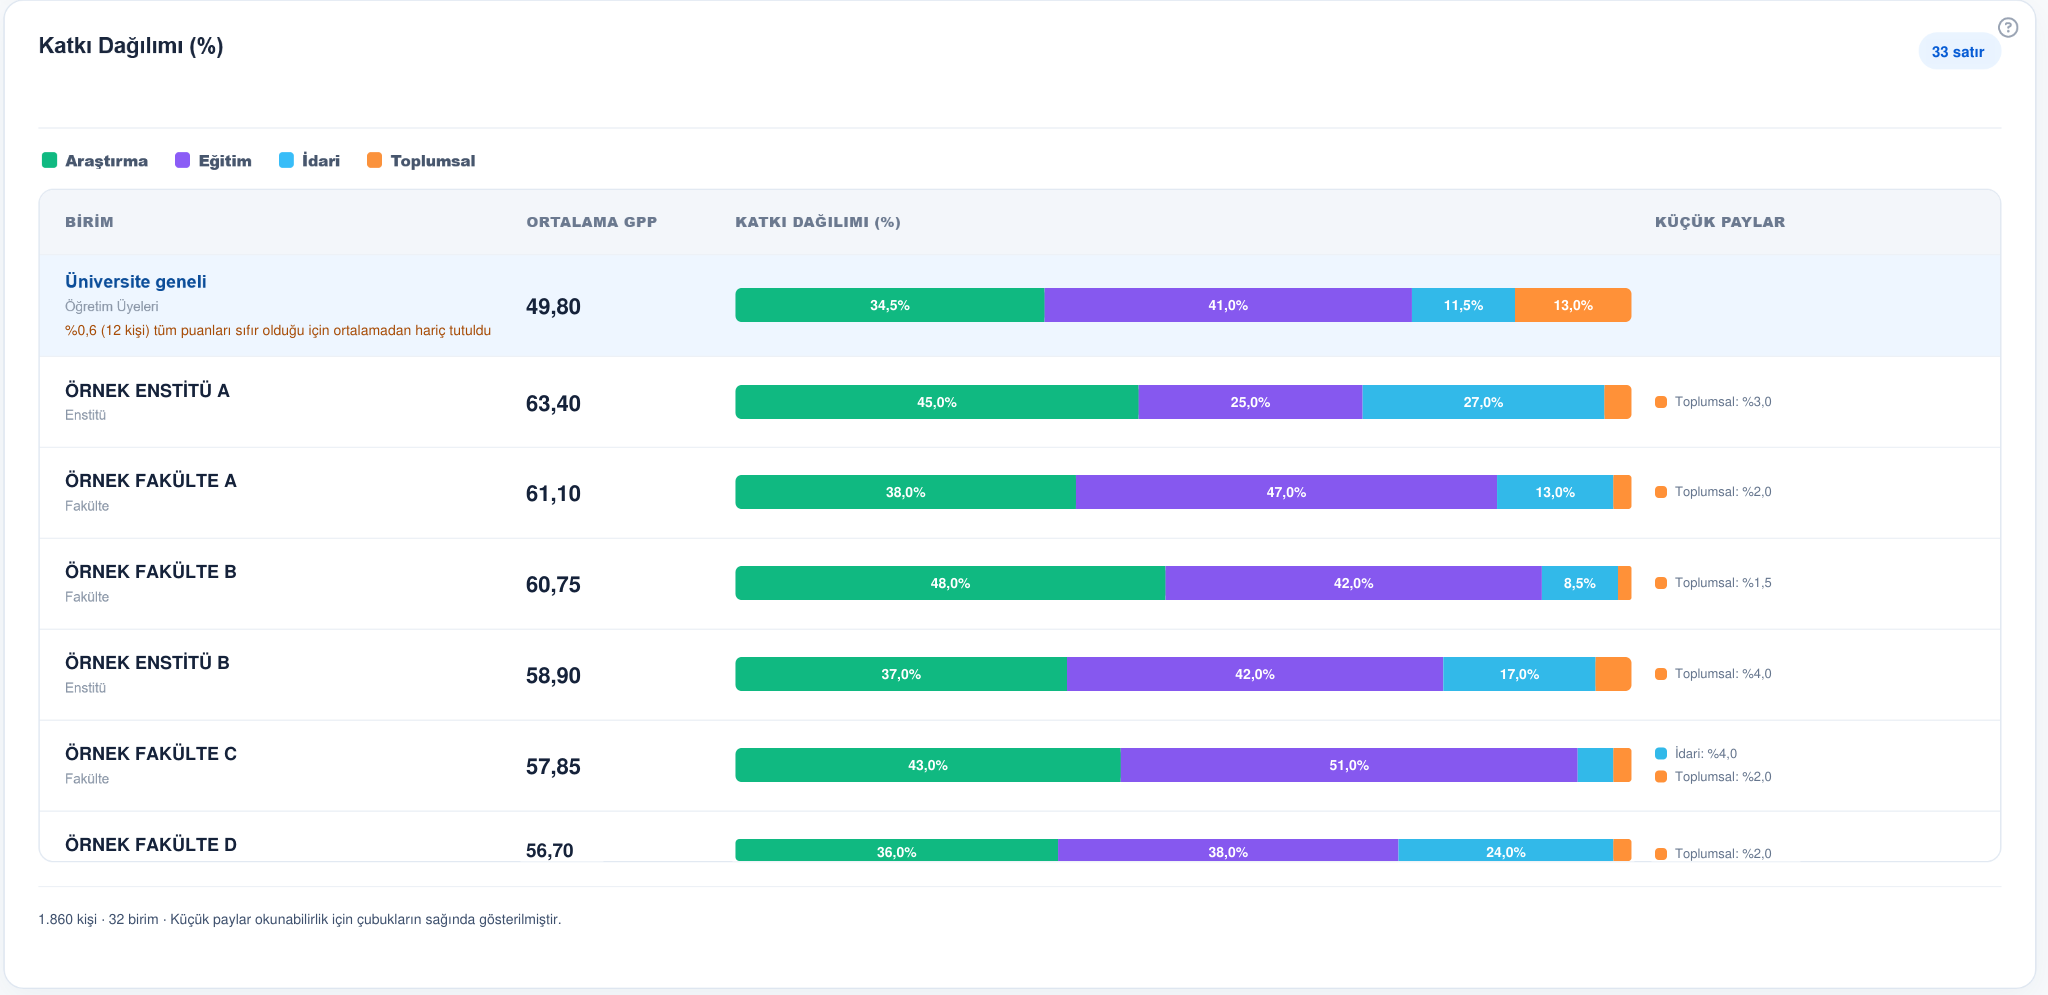
Figure 5: Contribution distribution. The shares of research, teaching, administrative and societal contributions in the total score after weighting.
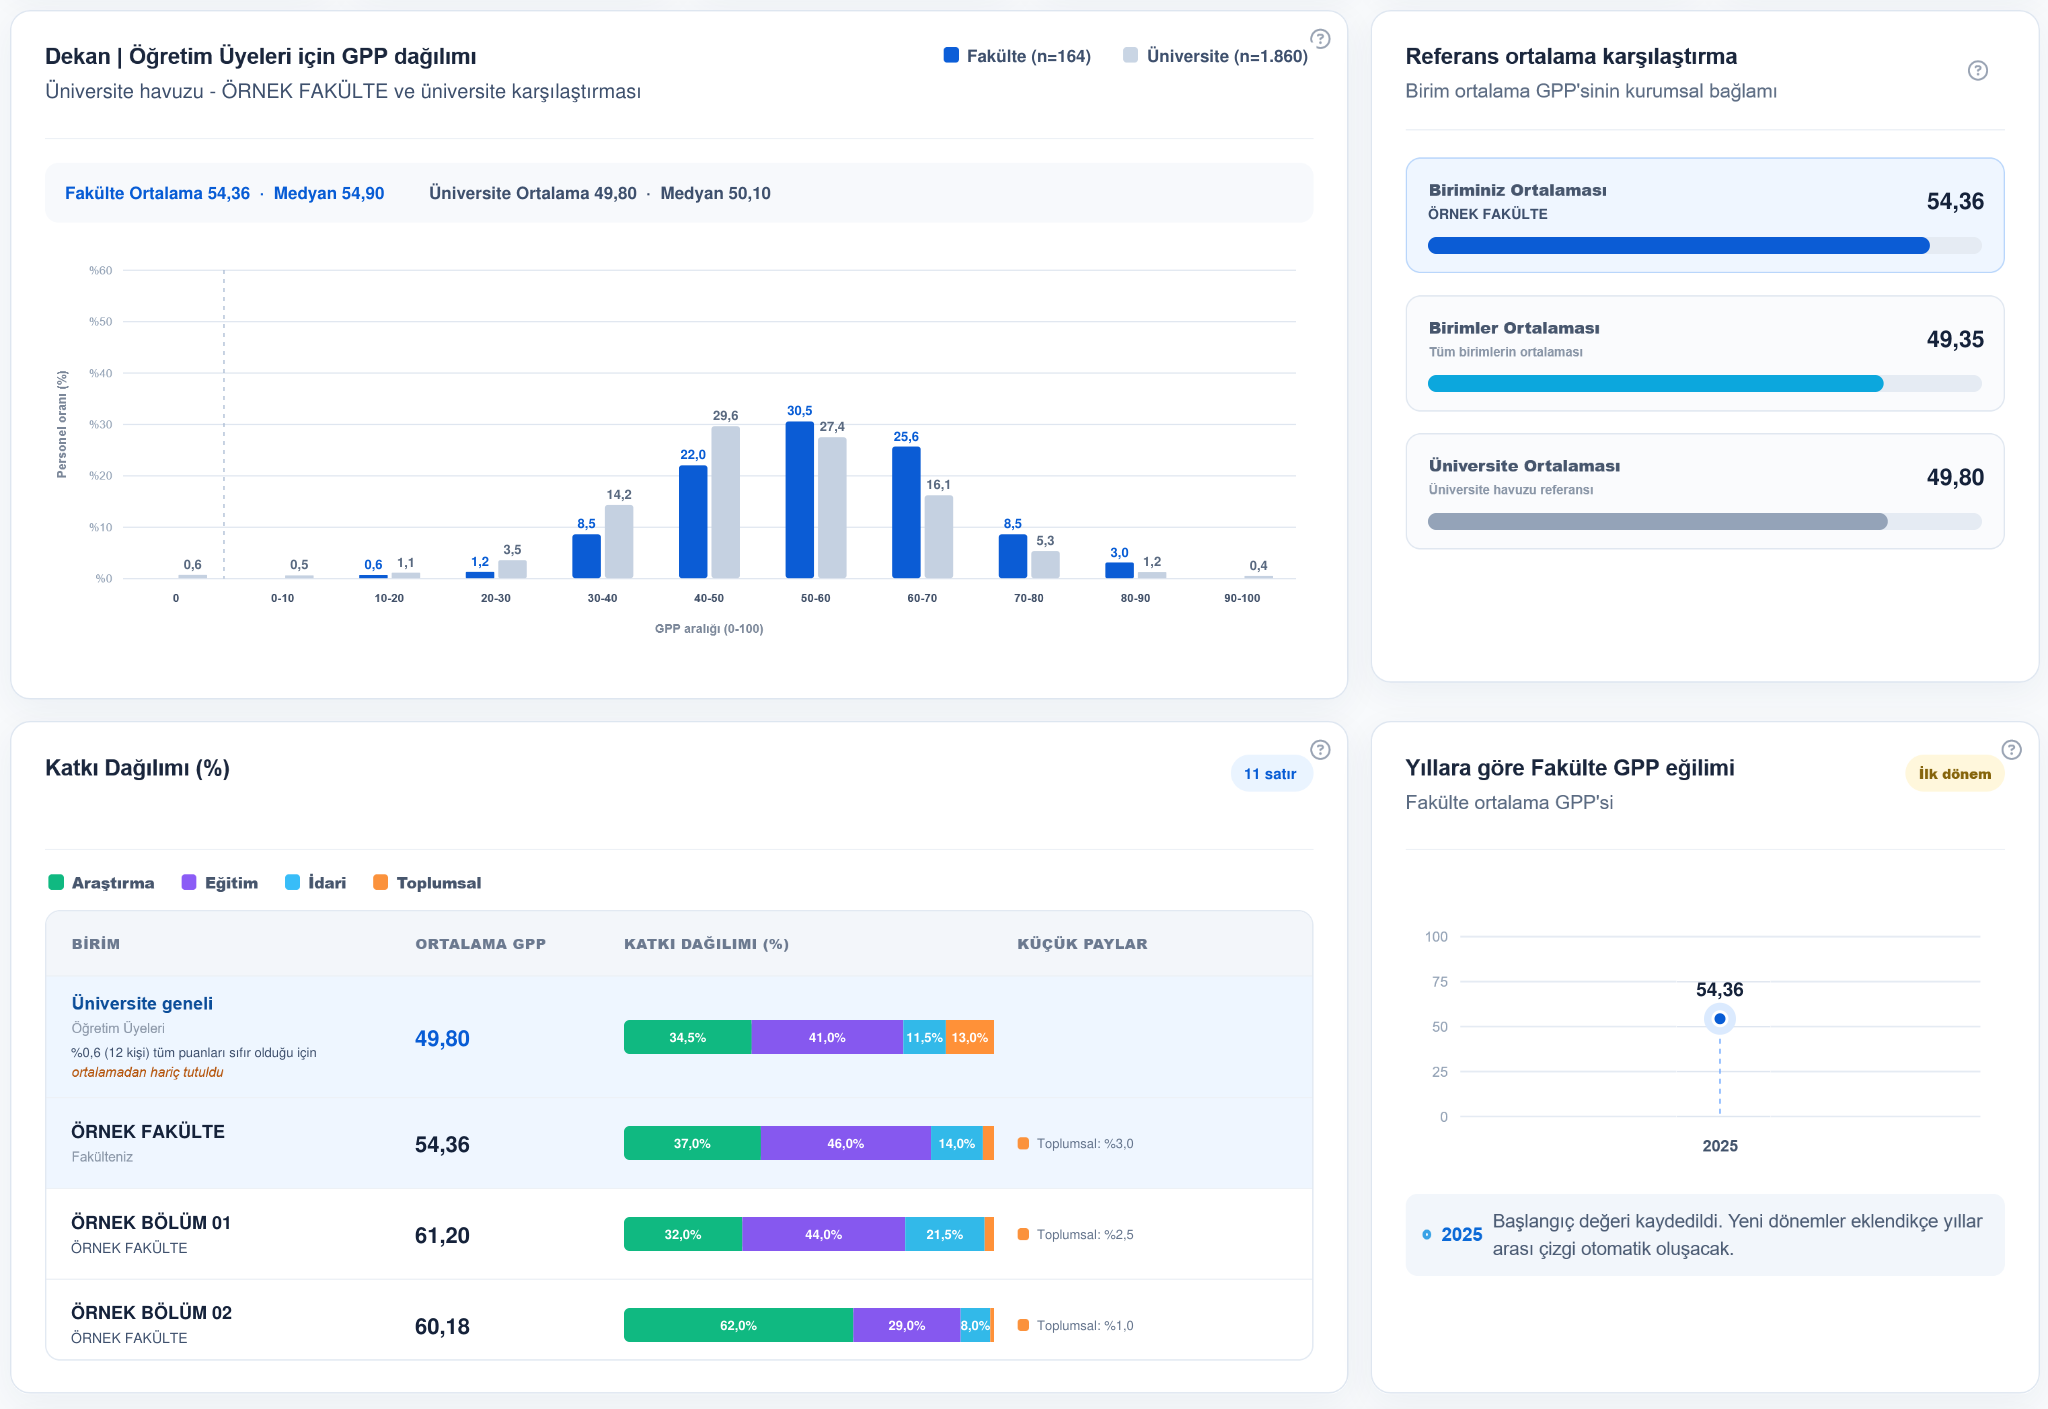
Figure 6: The sample faculty’s GPP distribution, comparison with reference averages and contribution profiles.
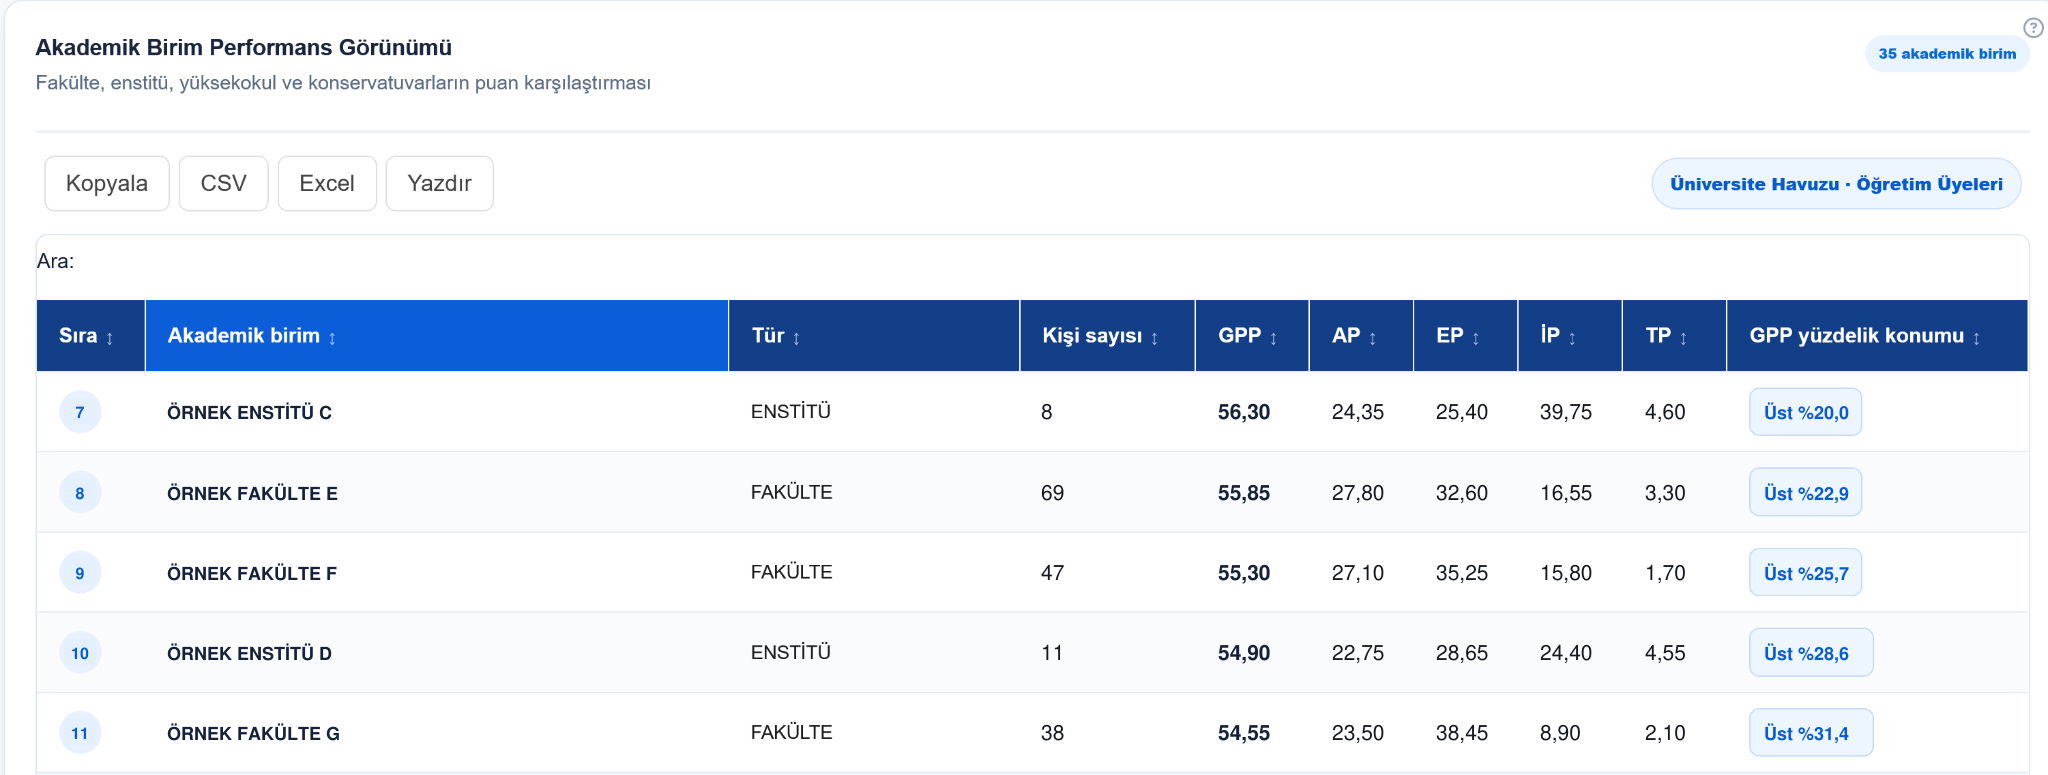
Figure 7: Academic unit performance. Average GPP and activity-area scores for academic units, together with their percentile positions in the GPP ranking.
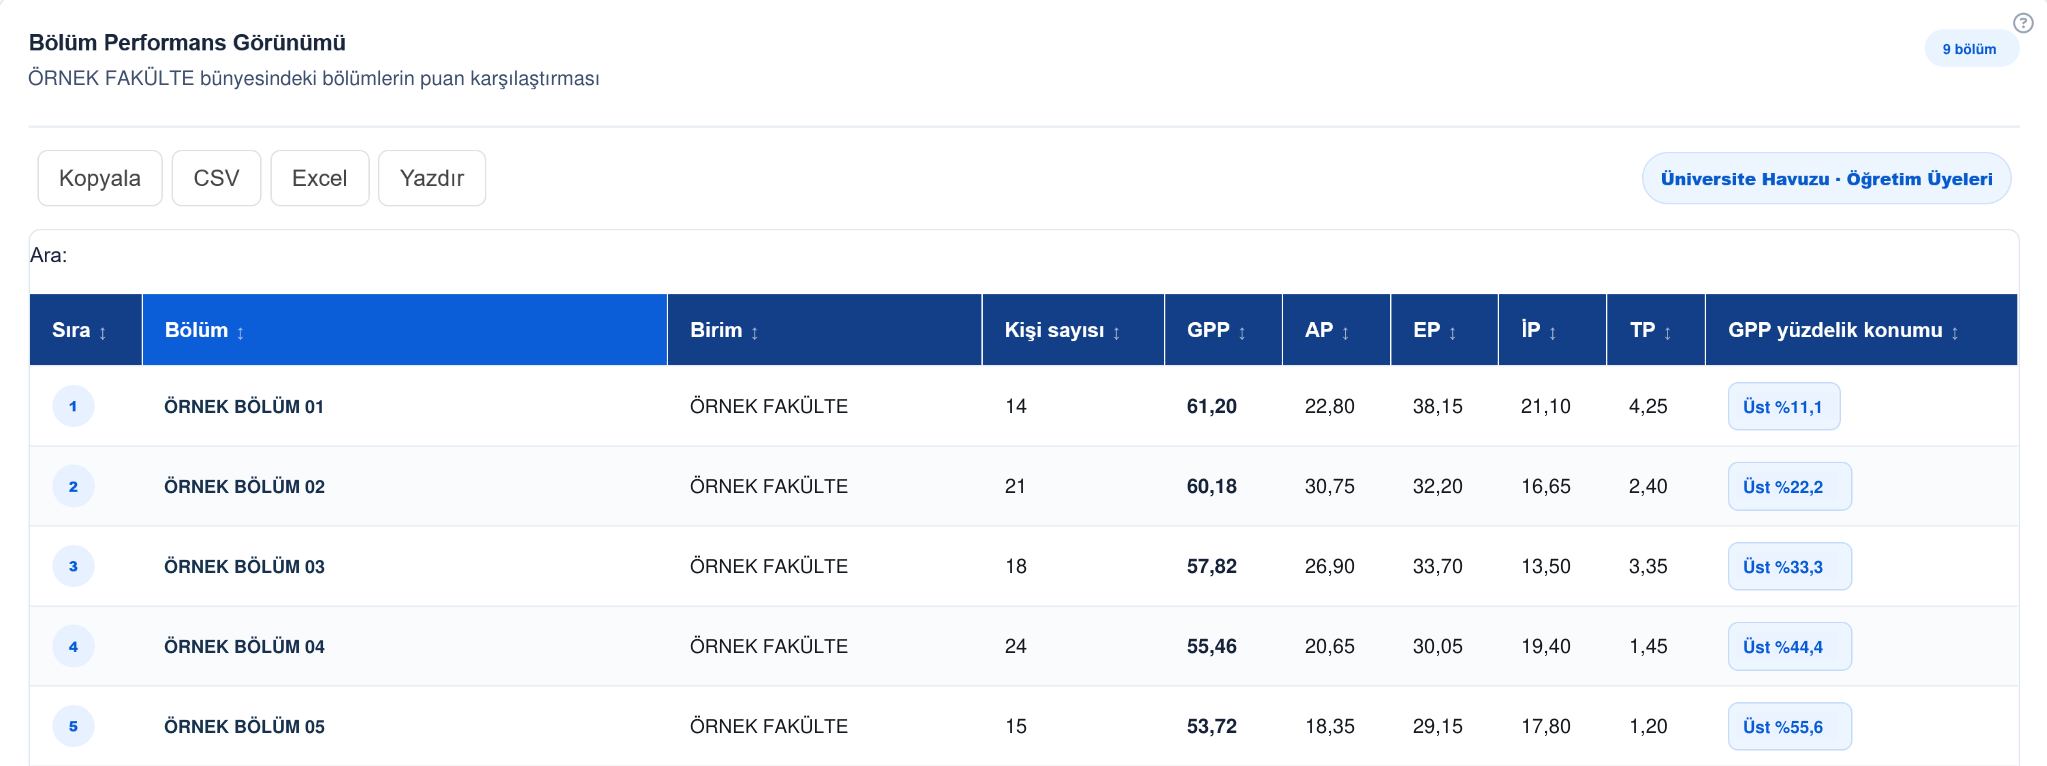
Figure 8: Department performance. Average scores for departments within a faculty and their percentile positions within that faculty.
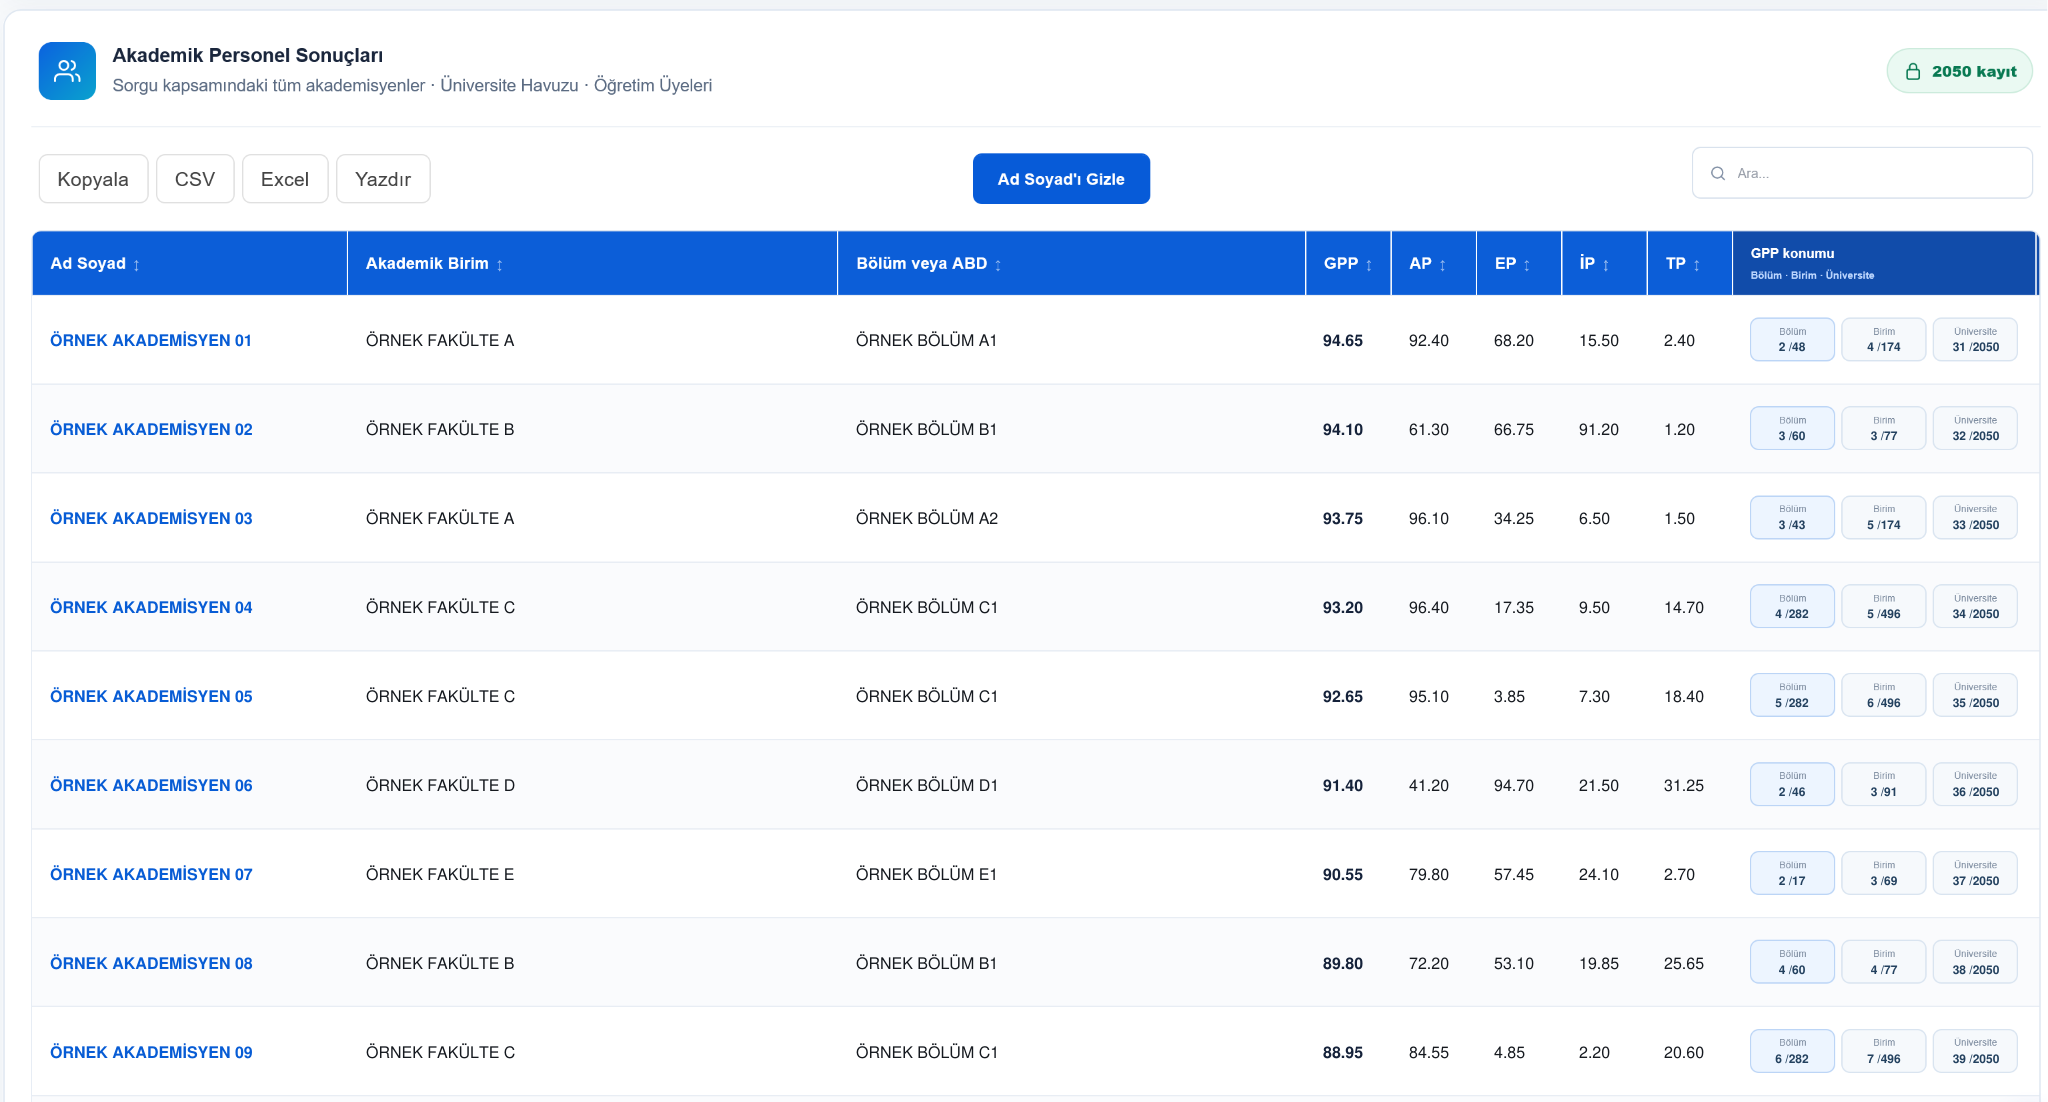
Figure 9: Academic staff results. Individual results within the user’s authorised scope and GPP rankings at department, unit and university levels.